up to 200%
the largest yield increase recorded, on a tomato crop grown in a polytunnel
Here is a brief account of the methodology, sources and figures behind the claims we make. If you are an ESG compliance officer, a grant assessor or a journalist, this is the section for you.
For our analysis we used the Big Climate Database (https://concito.dk/en), a database built on the Life Cycle Assessment methodology. For more than 540 food products, it provides a set of carbon emission factors regionalised for Denmark, the United Kingdom, the Netherlands, France and Spain. As a starting point for Romania, we use the emission coefficients calculated for Denmark.
Carbon emission coefficients are validated only for a few developed countries, where data was available to carry out an analysis. They take into account regional factors such as the type of farming (conventional or organic), the energy mix used in production or transport-specific aspects (short or long distance). This regional approach is highly precise, but of limited use for other countries or regions with heterogeneous conditions. What is more, frequent database updates (for example, v1.2 of September 2024 produced a climate impact 9% higher than v1.1) make historical comparisons difficult. Under these conditions, attributing carbon emission reductions to specific actions taken to that end becomes almost impossible.
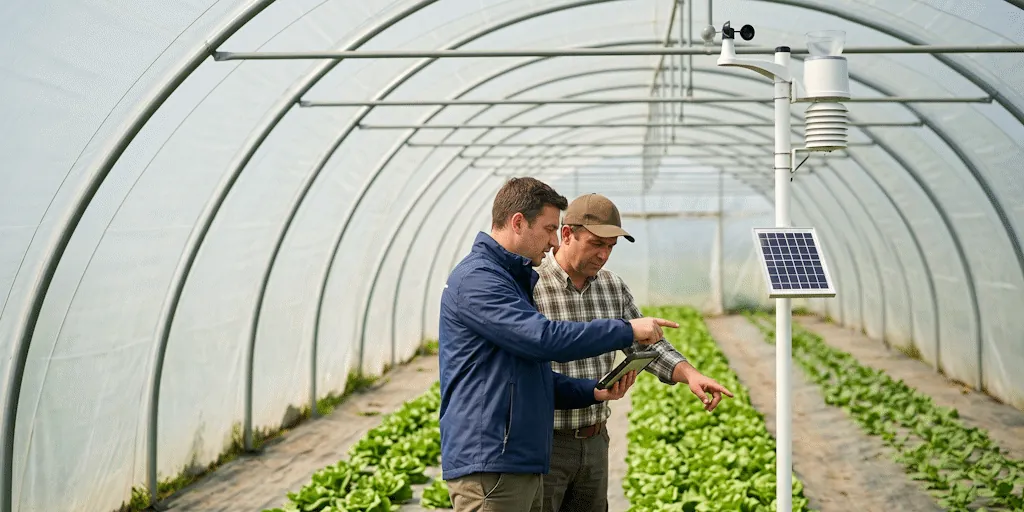
We use real field data to estimate carbon emissions at farmer level, across the contributing sub-factors: agriculture, packaging and transport. This is where the effect of agronomic decisions and of actions taken along the supply chain becomes visible — and where you can build a sustainability agenda that reduces the risk of misleading claims (greenwashing).
Between 2022 and 2024, the farms monitored by the Enten team saved approximately 350,000 m³ of water — the equivalent of 140 Olympic swimming pools. The reduction was the result of work by Enten agronomists, together with the farmers, to fine-tune crop irrigation schedules, based on the soil moisture and evapotranspiration data collected by our monitoring equipment.
Water saved does not appear as an explicit factor in the Big Climate Database, so the coefficients currently in use underestimate the carbon footprint of farmers whose irrigation practices are suboptimal. Including the water saved through better irrigation practices brings the carbon emission calculation closer to reality, and makes it more relevant for farmers in countries where farming is less technologically advanced or agricultural practices are inefficient.
Multi-drop deliveries — where a farmer delivers produce to several warehouses in the same trip — add unnecessary carbon emissions to the supply chain. Our dynamic delivery allocation algorithms, applied to a sample of 50 farmers supplying fresh vegetables to a retailer’s warehouses, led to a lower share of these deliveries in 2024 than in 2023, and so contributed to a lower carbon footprint for transport.
The capacity actually used when transporting produce remains a major lever for reducing the carbon footprint and operating costs of transport — our analysis shows average utilisation of 49% of a reference vehicle (Iveco Daily, 8 Euro pallets). 50% of suppliers are asked to make warehouse deliveries that fill less than 38% of the reference vehicle’s capacity.
Agriculture is the dominant source of carbon emissions in the fresh vegetable supply chain. It is also the hardest contributing factor to assess, because of complex interactions and a lack of granular data. Enten data lets us analyse emission sub-factors in detail, and this is where our agronomists can step in with specific measures to reduce them.


Carbon emission estimates for water and fertiliser use become far more accurate once irrigation and fertigation are automated — a project in the pilot phase with some of our clients. The footprint of crop protection treatments, the impact of heat and water stress on agricultural productivity, the emissions linked to the construction materials of greenhouses and polytunnels — all of these contributions will be added to our calculation under the bottom-up approach.
We mention these points because we firmly believe that a sustainability agenda that does not acknowledge what it does not yet measure will not survive its first serious audit. Everything else we claim, however, is documented with data.
We’ll prepare a tailored package of analyses and reports for retailers, processors, cooperatives and financial institutions.